Consider using a punchcard visualization when you want to represent both counts and proportionality over a time period across categorical data.
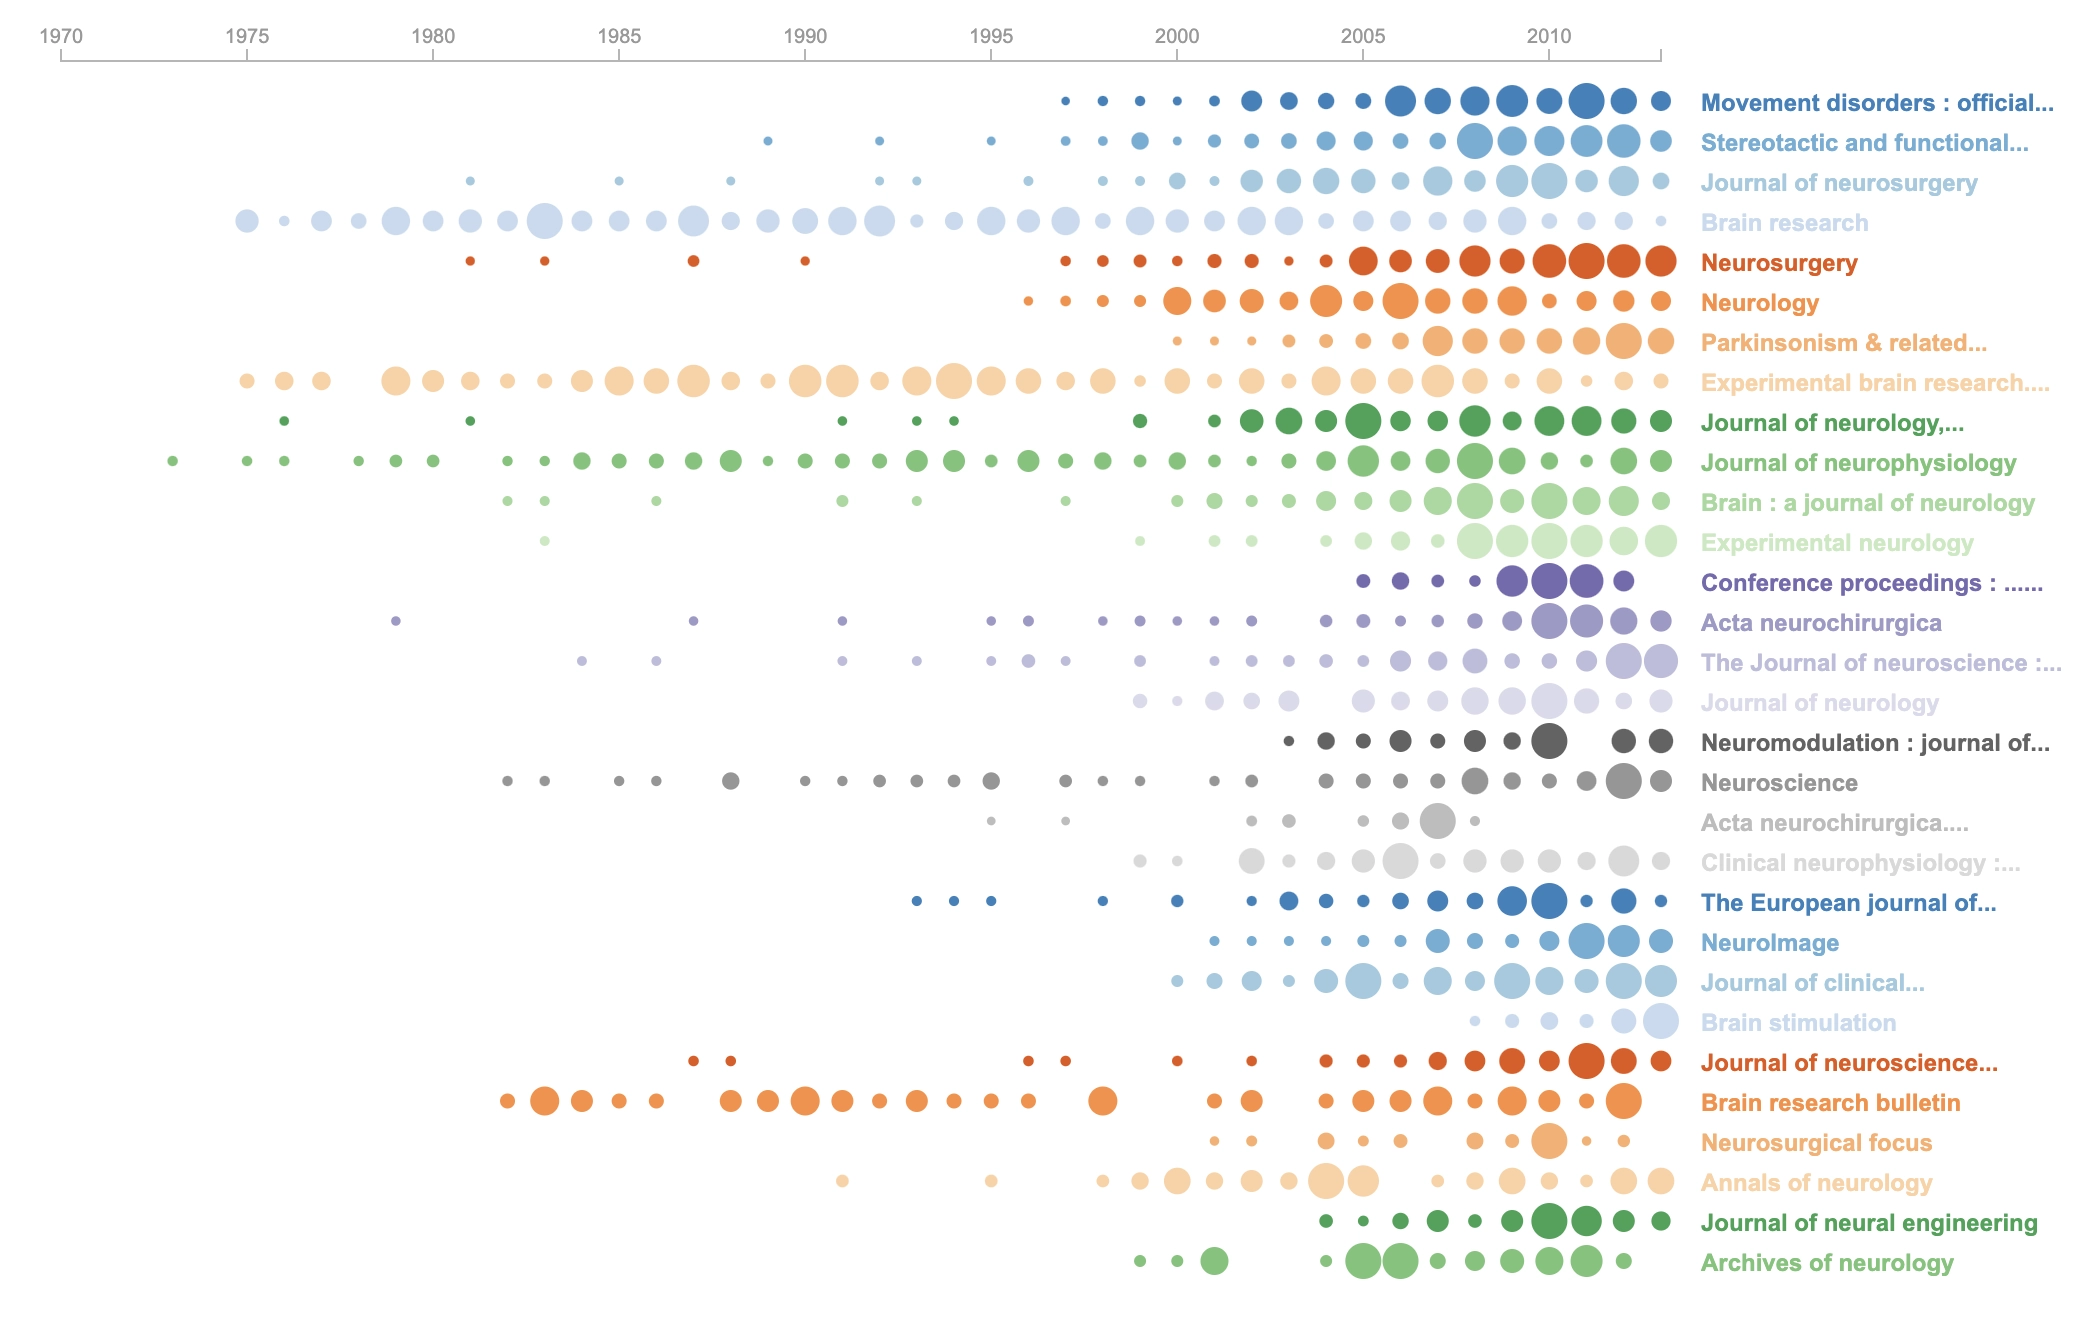
The graphic is particularly useful in interactive documents with hover effects showing the underlying count.