Audio biosignal processing of phonocardiograms
Spectral analysis of phonocardiograms using digital signal processing techniques
A phonocardiogram (PCG) is a non-invasive assessment of the mechanical function of the heart. Cardiac auscultation and the analysis of the phonocardiogram can unveil fundamental clinical information regarding heart malfunctioning caused by congenital and acquired heart disease. This is achieved by detecting abnormal sound waves, or heart murmurs, in the PCG signal. This article uses data from the 2022 PhysioNet challenge to explore the spectral properties of PCG signals.
Below we see the time domain signal for a 5 sec window of PCG data. We can clearly see the S1 and S2 waves, which correspond to the beginning and end of the systolic phase of the heart beat, respectively.
The corresponding spectrogram shows the power at each frequency over time. The beats are clearly visible in both the time and frequency domains. There is some high frequency noise at about 1.5sec that we will next remove using a digital filter.
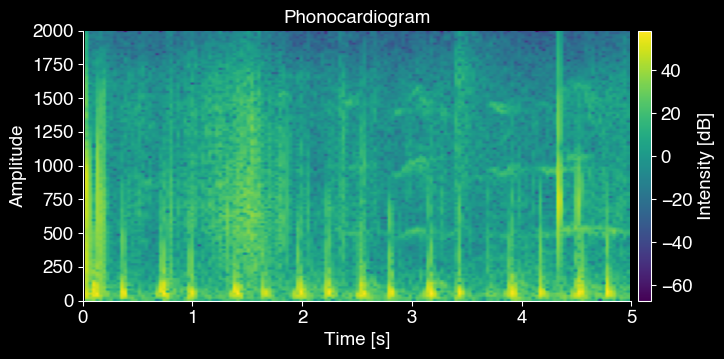
Spectrogram of the PCG signal
A Butterworth low-pass filter applied to this signal with 250 Hz cutoff frequency removes the high frequency noise at 1.5sec.
import scipy.signal

def butter(sig, freq, low_cutoff_hz, high_cutoff_hz, btype="low"):
    b, a = scipy.signal.butter(low_cutoff_hz, high_cutoff_hz / (freq / 2.0), btype)
    return scipy.signal.filtfilt(b, a, sig)
Most of the signal of interest is below 500Hz so low pass filtering removes the high frequency components and leaves the cardiac cycles intact. The figure below shows both the low pass filtered signal in the time domain (left) and frequency domain (right) on top and the high pass filtered signal on the bottom.
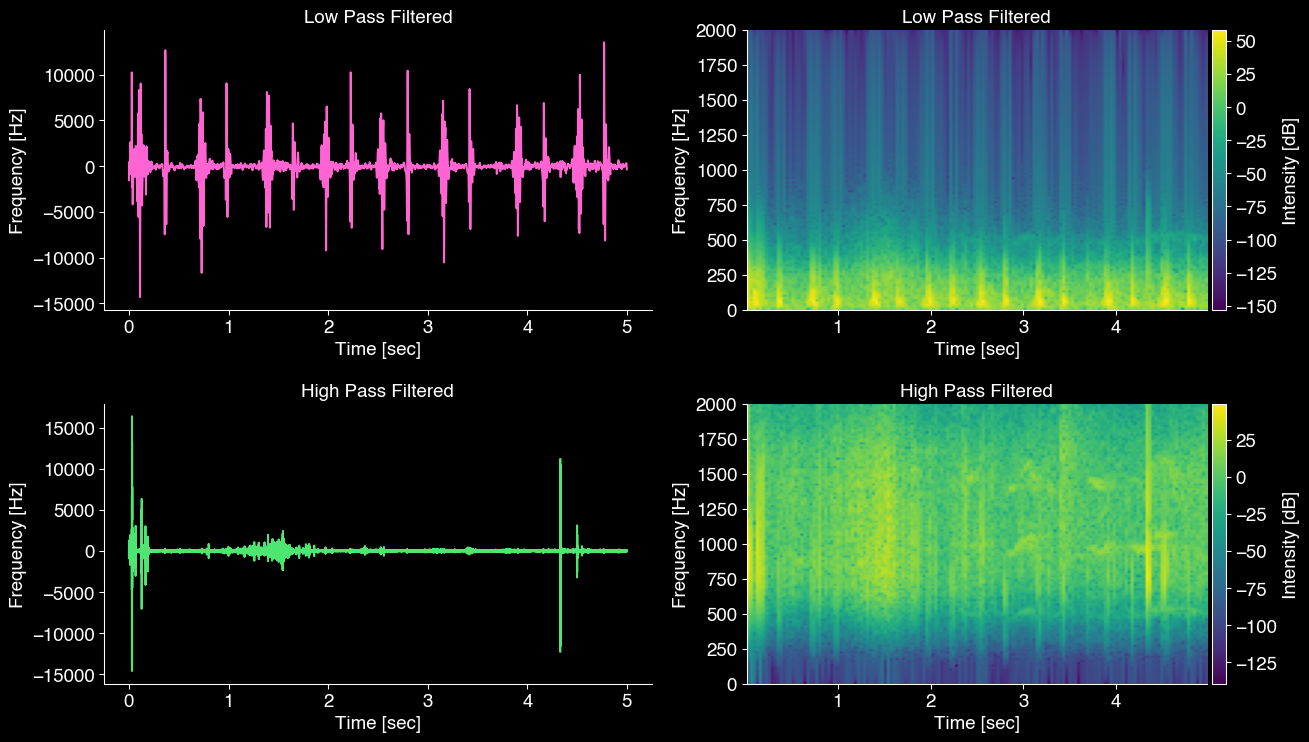
Low and high passed signals
Zooming in shows the cardiac cycles in more detail.
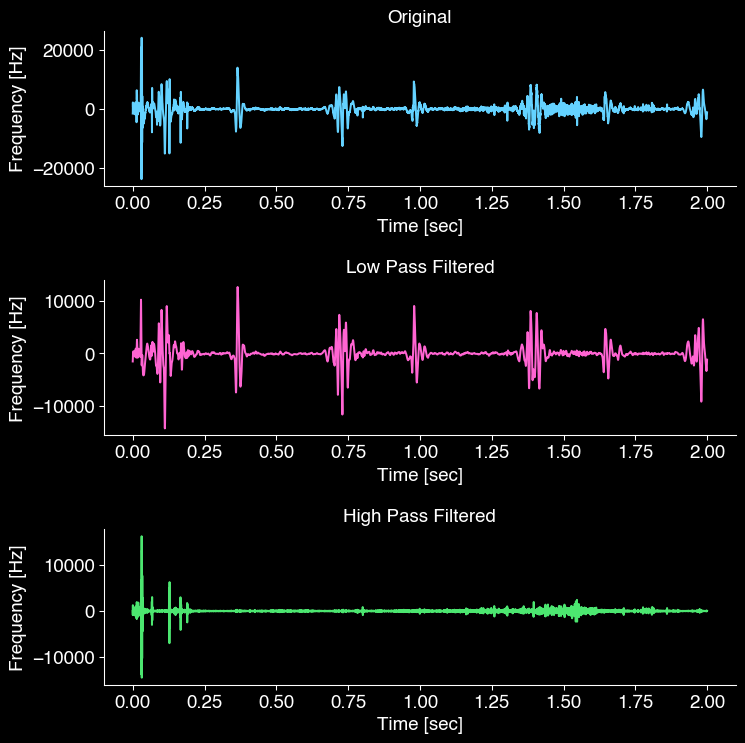
Original, low, and high passed signals