High accuracy complex models, like neural networks and generalized additive models, come at the expense of interpretability. The contribution of individual features to the outcome are difficult to understand in complex models and have recieved significant criticism, partcularly in high-stakes settings (like medicine and criminal cases) where trust is critical. Intelligible models develop trust with the user and helps us debug counter-intuitive or inaccurate relationships learned by the model. Before applying complex models, it's usually a good idea to look at odds ratios and risk curves to visualzie how each variable is related to the outcome. Odds ratios can quantify the strength of the relationship and is a good first step in ranking features that have a strong association with the outcome, compared to features with weaker associations. Risk curves help us visualize the shape of the association (e.g. linear, non-linear, monotonic, increasing, decreasing).
Odds-ratios
Odds ratios are widely used to compare the relative odds of the occurrence of the outcome (e.g. disease), given exposure to a feature. The odds ratio can also be used to determine whether a particular feature is a risk factor for a an outcome, and to compare the magnitude of various risk factors for that outcome.
- OR = 1 Feature does not affect odds of outcome
- OR > 1 Feature is associated with higher odds of outcome
- OR < 1 Feature is associated with lower odds of outcome
import statsmodels.api as sm
from scipy import stats
stats.chisqprob = lambda chisq, df: stats.chi2.sf(chisq, df)

def univariatelr(X,Y,feature_name,binary=False):
    res = sm.Logit(Y, X, missing='drop').fit(disp=0, intercept=True)
    ci = np.round(np.exp(res.conf_int(alpha=0.05, cols=None)),2).squeeze()
    r = {'feature':feature_name,
         'nobs': np.sum(X==1) if binary else res.nobs,
         'coeff': round(res.params[0],2),
         'OR': round(np.exp(res.params[0]),2),
         'ci_low': ci[0],
         'ci_high': ci[1],
         'p-value': np.round(res.pvalues[0],2)}
    return r
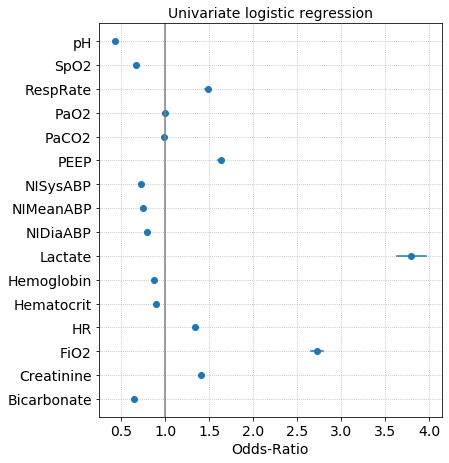
The coefficients of a logistic regression model are the log-odds and taking the exponential of the coefficient gives us the odds-ratio. Odds-ratios are plotted along with the confidence interval. If the confidence interval overlaps with OR=1, than the feature has a weak or no association with the outcome. Below is an example of the odds-ratios from univariate logistic regressions where the outcome label is survived or expired in the ICU.
Risk curves
Risk curves describe the relationship between a feature and an outcome. For example a risk curve can be used to understand the relationship between a physiological measure like heart rate and an outcome like the probability of developing a disease. These graphical interpretations help explain hidden relationships in data, are interpretable by a non-technical audience, and relatively easy to construct.
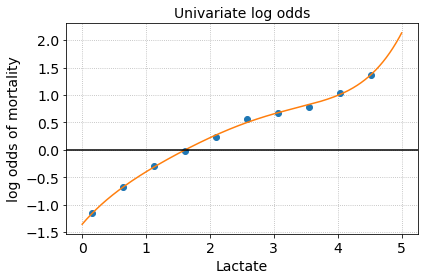
The risk curve for lactate shows that the risk of mortality monotonically increases with increasing lactate. We could also reasonably draw a cutoff around Lactate > 2 mmol to and group these high lactate patients for further analysis.
Building such a risk curve is simple enough. Given a table of feature value and label:
| Value | Label |
|---|---|
| 0.800 | 0 |
| 4.767 | 1 |
| 0.700 | 0 |
| 1.100 | 0 |
| 1.575 | 0 |
First bucket each sample into a bin, for example: (0.1 , 0.6), (0.6, 1.2), ..., (4.4, 5.). You can use quantiles to determine these bins or just equally divide your data into bins. We can use the histogram function to divide our data into equal sized bins with a specified range and count the number of samples that fall into each bin (h_control, h_treated).
x = df.Value
y = df.Label
x = x[(x>=minval) & (x<=maxval)]
xmin = x.min()
xmax = x.max()
h_control, b_control = np.histogram(x[y==0], range=(xmin, xmax), bins=10)
h_treated, b_treated = np.histogram(x[y==1], range=(xmin, xmax), bins=10)
risk = np.log((h_treated/h_treated.sum())/(h_control/h_control.sum()))
vals = b_unstable[:-1]
plt.plot(vals, risk)
The log-odds (risk) is simply the fraction of treated samples in the bin divided by the fraction of untreated samples in the bin.