ECG beat detection algorithm
Detecting the R-peak of the QRS complex in an ECG signal using the Pan-Tompkins algorithm.
A basic component of processing electrocardiogram (ECG) signals is detecting the heart beat. Beat detection is used to calculate the heart rate, to derive measures of heart rate variability, to develop signal quality indicators, and to detect diseases. There are thousands of publications and strategies to detecting the R-peak of the QRS complex of a heart beat from an ECG signal with varying degrees of accuracy (see section on other beat detection algorithms for a survey). Methods can range from threshold based peak detectors, to wavelet-based signal processing, to probabilistically combining multiple methods.
We will use the Pan-Tompkins algorithm, one of the most widely implemented peak-detection algorithms, to detect the R-peak of the ECG signal in this chapter. Data for this exercise is from the 2017 Physionet Challenge which was aimed to classifying atrial fibrillation from single channel ECG signals. The data was sampled at 300 Hz and band pass filtered. First, we start with a short introduction to ECG wave analysis.
ECG waves
ECG analysis starts with understanding the wave morphology and intervals.
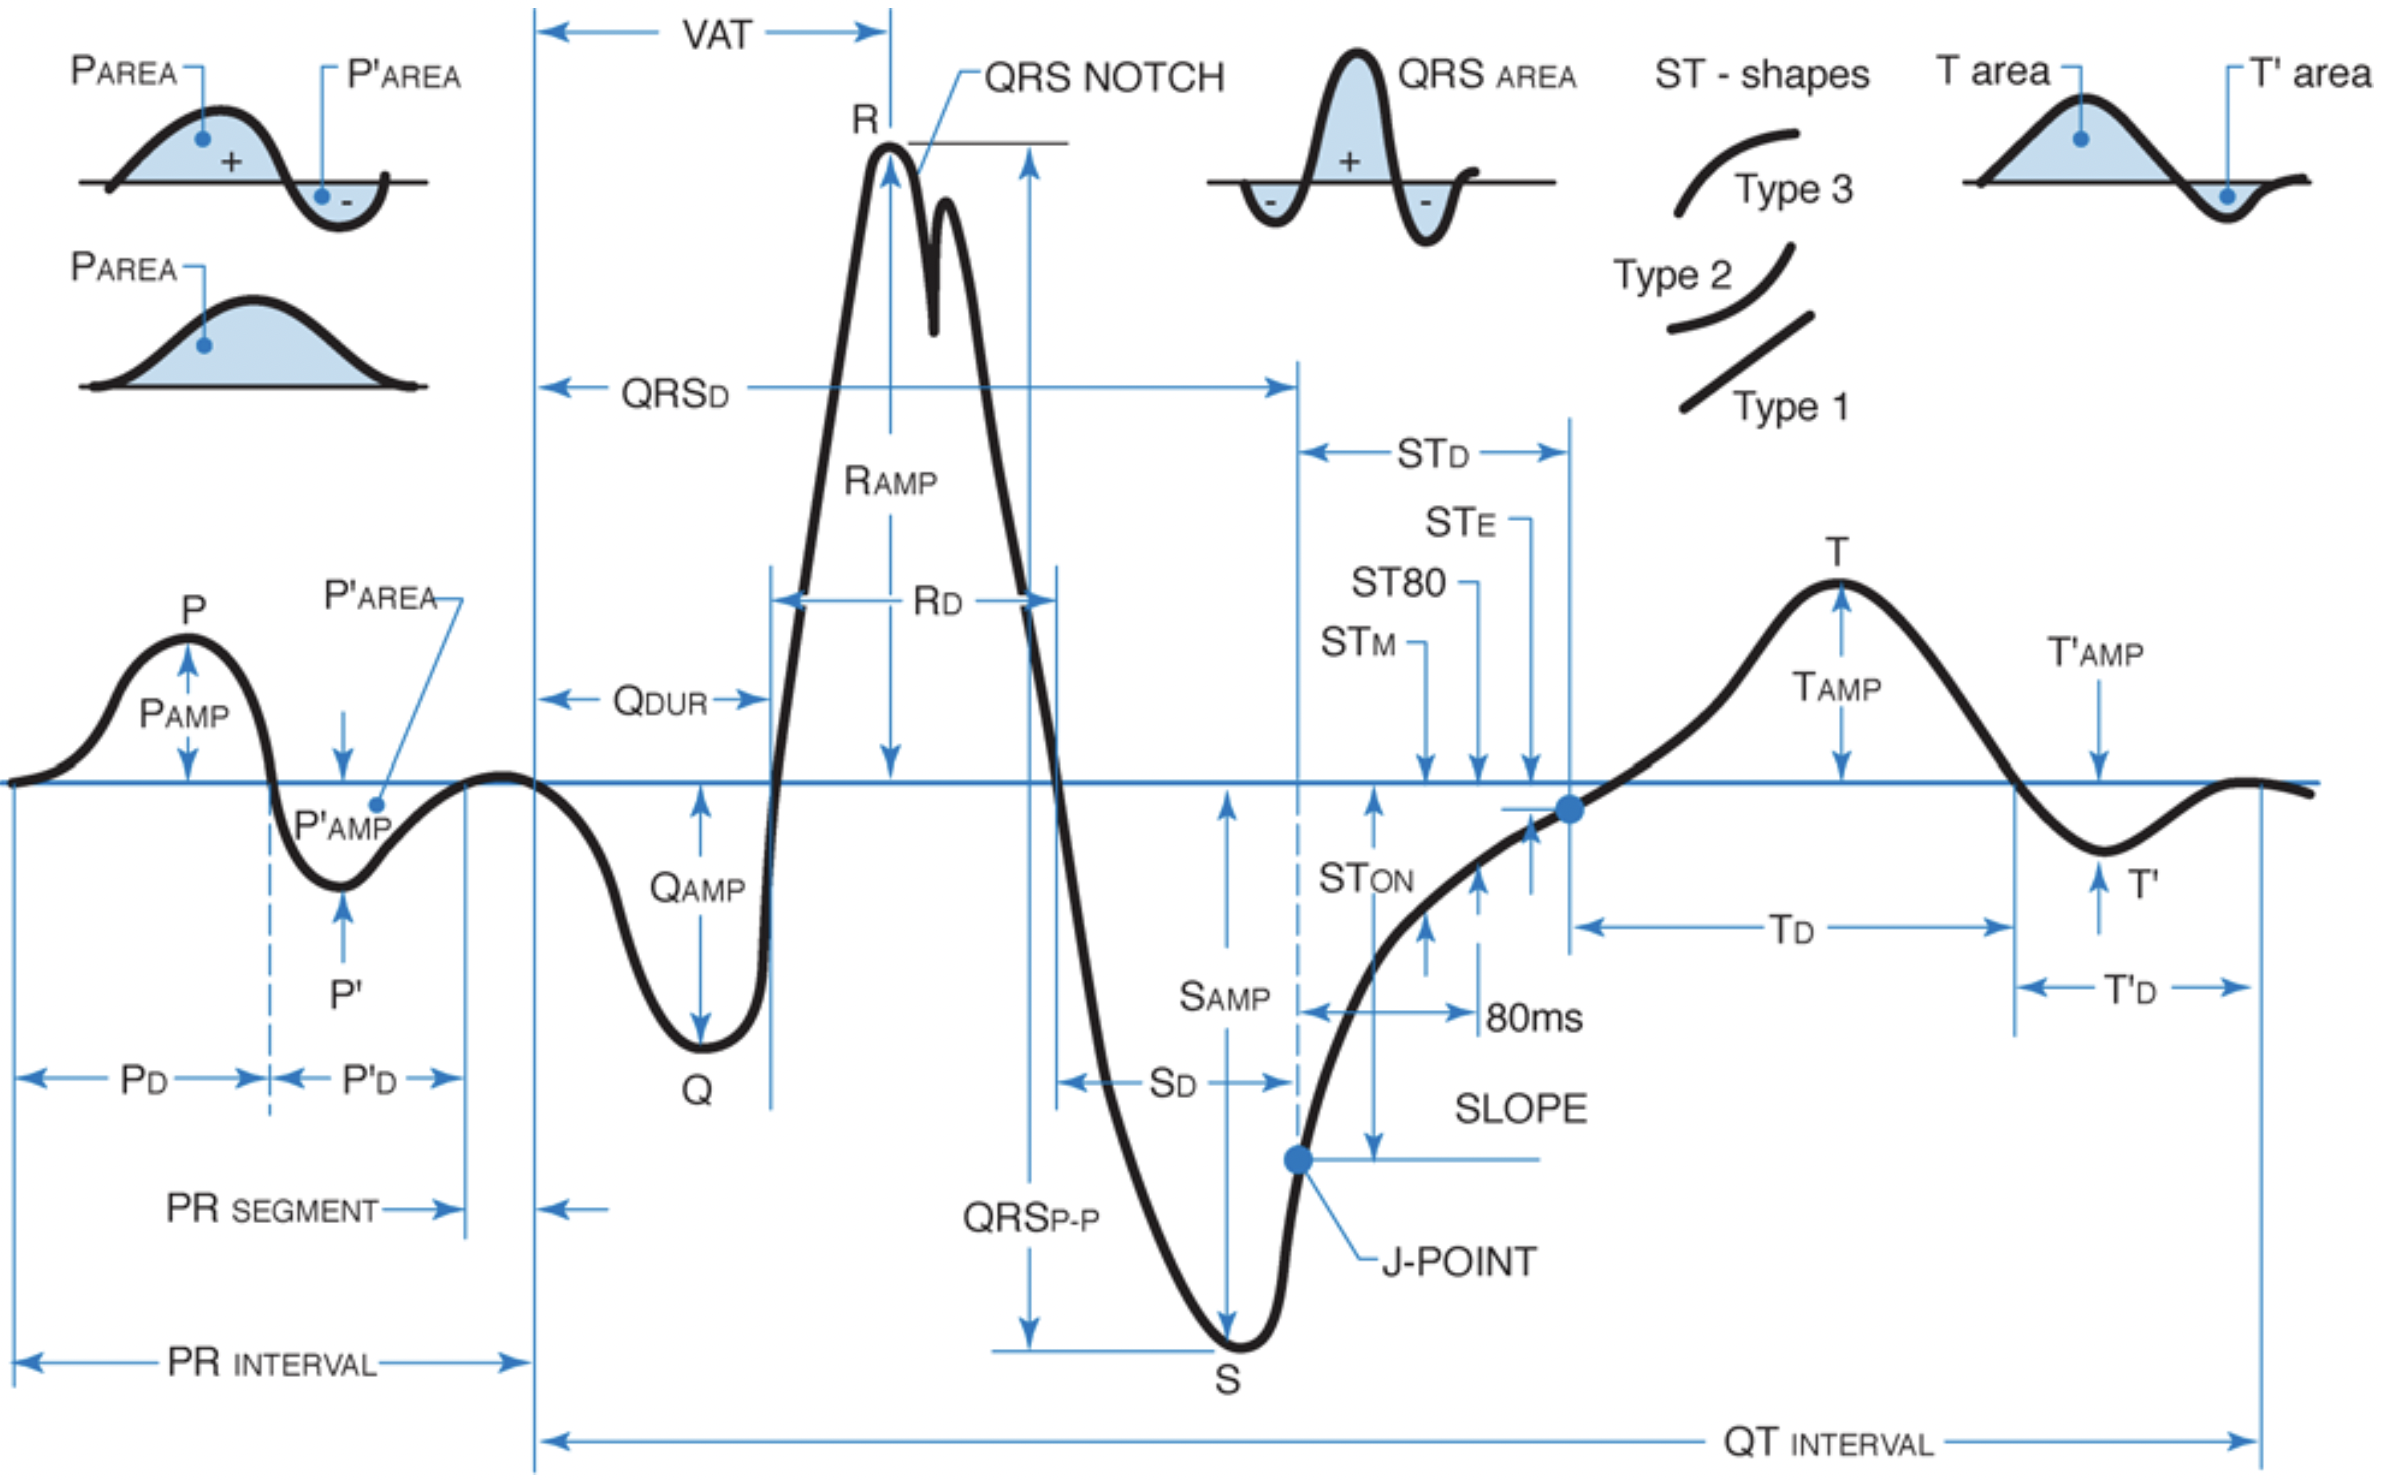
Features derived from the a single beat in an ECG. Picture from Philips DXL ECG Algorithm Physician Guide
The P-wave reflects atrial deploarization. The amplitude of the P-wave is decreases in diseases like atrial fibrillation, which is a type of arrythmia or abnormal heartbeat. Therefore, we typically want to quantify the amplitude and duration of the P-wave for AFib classification. The distance between the P-wave onset and onset of the QRS complex is the PR interval with a normal duration of 120-220 ms.
The QRS complex reflects depolarization of the left ventricle (since the electrical vector of the left ventricle is much larger than that of the right ventricle). A short QRS duration proves the ventricles are functioning properly and a broad QRS duration indicates that ventricular activation is slow and there could be a dysfunction in the electrical conduction system of the heart. The R-peak of the QRS complex is used to calculate the instantaneous heart rate from the interval between subsequent R-peaks (RR-interval). An RR-interval of 400 ms is equivalent to an instantaneous heart rate of 150 beats per minute ($60 s / 400 ms * 1000 ms / s$).
The ST segment is another important morphological feature of the ECG wave since ST elevation and depression are both associated with heart dysfunction like acute myocardial ischemia or ST-elevation myocardial infarction (STEMI). Elevation or depression are calculated as the difference (in millimeters) between the J point (where the ST segment starts) and the PR segment. Finally, the T-wave reflects a repolarization of the contractile cells and is also associated with a range o heart conditions.
Pan-Thompkins algorithm
The Pan-Thompkins algorithm is widely used and can be used for real-time continuous QRS detection. The algorithm is based on analysis of slope, width, and amplitude of ECG using a series of filters. An ECG signal first goes through a bandpass filter, then a differentiator, a squaring operation, a moving window integrator, and finally adaptive thresholding and search-back to find the R-peak.
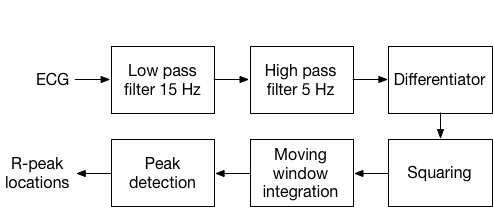
Pan-Thompkins algorithm for QRS detection.
Raw ECG signals include muscle noise (from respiration), motion artifacts, the QRS complex, and P-T Waves. The band pass filter is designed to match the spectrum of QRS complex, attenuates muscle noise, 60Hz interference, baseline wander, and T-wave interference. Pass band of 5-15 Hz maximizes the QRS energy.
Filtering on waveforms can have negative effects. While low pass filters successfully reduce noise in ECG traces, they also reduce the QRS amplitude. High pass filters (e.g. low cutoff at 0.5 Hz) reduce baseline wander, but also introduce ST distortion. Using forward/backward filtering (highpass, reverse time, highpass, reverse time) removes most of the distortion introduced by high pass filters on the ST segment.
Here we use cascading filters combining a low pass filter and a high pass filter to mimic a bandpass filter. The filter attenuates the P and T waves (which peak at <5 Hz), which is a desired feature since the goal is to detect the QRS complex.
The filtered ECG is then differenced and squared to amplify the QRS complex. The derivative filter further suppresses low frequency components of P and T waves. Squaring makes the signal positive and enhances the derivatives by amplifying the high frequency QRS complex.
Next, the moving average filter over a 150ms window captures the duration of the QRS complex and gives us the integrated signal. This suppresses the smaller oscillations by smoothing out the residual high frequency components. Here we have to define an optimal window length for the moving average. Large windows merge the QRS and T waves together and small windows would produce several peaks at the QRS complex making it difficult to find the R-peak. In addition to detecting the QRS complex the moving average filter gives us the width of the QRS complex.
There are numerous heurestics for peak detection from the integrated signal (e.g. simple thresholding of the moving window integral). Pan-Thompkins proposes to use adpative thresholding and search-back to select a range of time values that correspond to QRS complexes by adapting to changes in ECG by computing running estimates of signal and noise peaks. Here instead I smooth the integrated signal with a gaussian filter to get the energy of the signal. The peak then corresponds to zero-crossings of the first difference where $x[i+1] < x[i]$.
import numpy as np
import scipy.signal

ecg = np.loadtxt("ecg.txt")  # load the ECG signal
fs = 300  # Hz
tvec = np.arange(len(ecg)) / fs  # time vector

max_QRS_duration = 0.150  # sec
low_cutoff = 5
high_cutoff = 15
window_size = int(max_QRS_duration * fs)

# apply a bandpass filter to the ECG signal
lowpass = scipy.signal.butter(1, high_cutoff / (fs / 2.0), "low")
highpass = scipy.signal.butter(1, low_cutoff / (fs / 2.0), "high")
ecg_low = scipy.signal.filtfilt(*lowpass, x=ecg)
ecg_band = scipy.signal.filtfilt(*highpass, x=ecg_low)

diff = np.diff(ecg_band)
squared = np.square(diff)

# moving average filter
# apply padding on both sides of the signal and convolve to get the integrated signal
mwa = np.pad(squared, (window_size - 1, 0), "constant", constant_values=(0, 0))
mwa = np.convolve(mwa, np.ones(window_size), "valid")
for i in range(1, window_size):
    mwa[i - 1] = mwa[i - 1] / i
mwa[window_size - 1 :] = mwa[window_size - 1 :] / window_size
mwa[: int(max_QRS_duration * fs * 2)] = 0

# smooth the moving window integrated signal with a gaussian filter and take the derivative
energy = scipy.ndimage.gaussian_filter1d(mwa, fs / 8.0)
energy_diff = np.diff(energy)

# peaks are the points where the derivative crosses zero, adjust window size
zero_crossings = (energy_diff[:-1] > 0) & (energy_diff[1:] < 0)
zero_crossings = np.flatnonzero(zero_crossings)
zero_crossings -= int(window_size / 2)
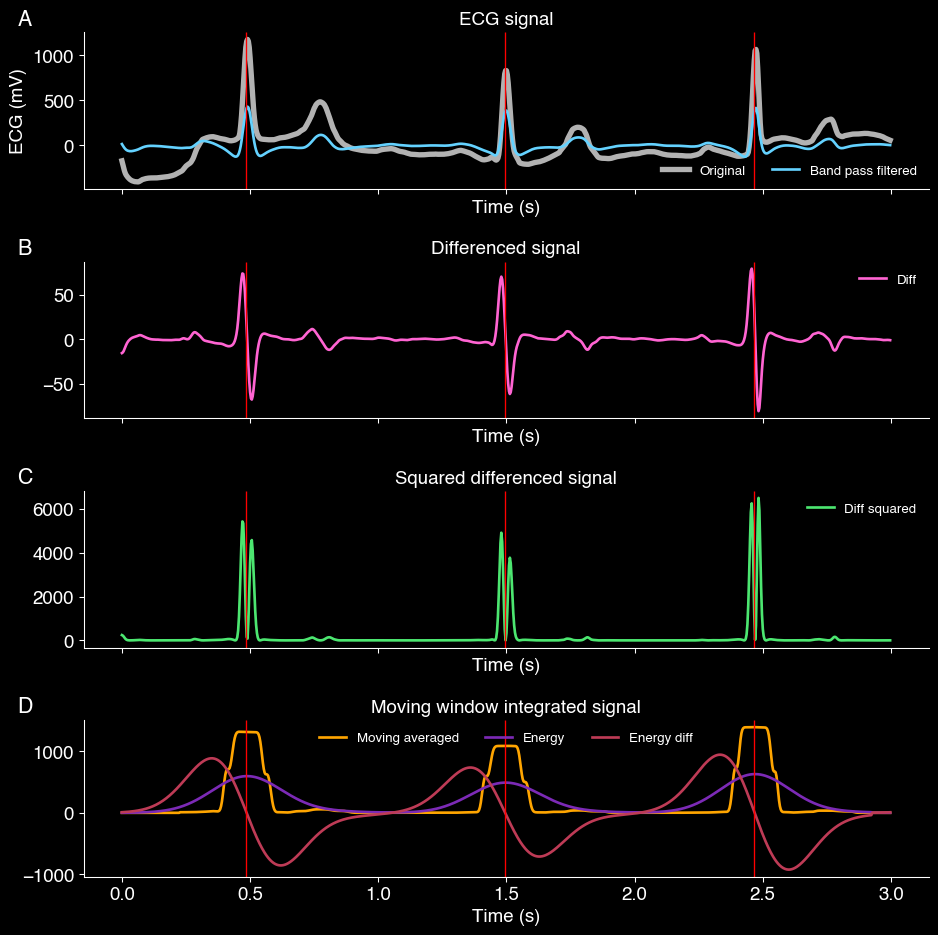
Stages of the beat detection algorithm. The vertical red line indicates the peaks of the QRS complex.
The figure above visualizes each step of the beat detection algorith. The vertical red line are all the zero-crossings (zero_crossings), which lines up with the peak of the ECG signal.
Other beat detection algorithms
| Algorithm | Reference |
|---|---|
| Zeelenberg (1979) | Engelse, W.A.H., Zeelenberg, C (1979). A single scan algorithm for QRS detection and feature extraction, IEEE Comp. in Cardiology, vol. 6, pp. 37-42. |
| Pan (1985) | Pan, J., & Tompkins, W. J. (1985). A real-time QRS detection algorithm. IEEE transactions on biomedical engineering, (3), 230-236. |
| Hamilton (2002) | Hamilton, P. (2002, September). Open source ECG analysis. In Computers in cardiology (pp. 101-104). IEEE. |
| Zong (2003) | Zong, W., Heldt, T., Moody, G. B., & Mark, R. G. (2003). An open-source algorithm to detect onset of arterial blood pressure pulses. In Computers in Cardiology, 2003 (pp. 259-262). IEEE. |
| Christov (2004) | Ivaylo I. Christov, Real time electrocardiogram QRS detection using combined adaptive threshold, BioMedical Engineering OnLine 2004, vol. 3:28, 2004. |
| Elgendi (2010) | Elgendi, Mohamed & Jonkman, Mirjam & De Boer, Friso. (2010). Frequency Bands Effects on QRS Detection. The 3rd International Conference on Bio-inspired Systems and Signal Processing (BIOSIGNALS2010). 428-431. |
| Kalidas (2017) | Vignesh Kalidas and Lakshman Tamil (2017). Real-time QRS detector using Stationary Wavelet Transform for Automated ECG Analysis. In: 2017 IEEE 17th International Conference on Bioinformatics and Bioengineering (BIBE). Uses the Pan and Tompkins thresolding. |
| Nabian (2018) | Nabian, M., Yin, Y., Wormwood, J., Quigley, K. S., Barrett, L. F., Ostadabbas, S. (2018). An Open-Source Feature Extraction Tool for the Analysis of Peripheral Physiological Data. IEEE Journal of Translational Engineering in Health and Medicine, 6, 1-11. |
| Rodrigues (2021) | Rodrigues, Tiago & Samoutphonh, Sirisack & Plácido da Silva, Hugo & Fred, Ana. (2021). A Low-Complexity R-peak Detection Algorithm with Adaptive Thresholding for Wearable Devices. |